Creating Customer Lifetime Value (CLTV) metrics across 4 companies has led us to business partnering with virtually every department that touches the customer.
Sales, marketing, operations, you name it.
And better yet? It got us promoted FASTER.
CLTV helps narrow focus to maximize company spending for the biggest long-term return.
Think customer segmentation, new product launches, and marketing spend efficiency.
You can get promoted faster using this analysis too.
Let’s dive right in.
What you need
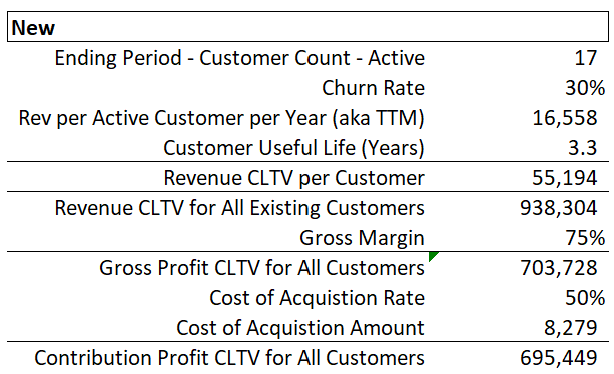
At a glance, here’s what CTLV will look like in excel when all’s said and done.

To start you’ll need a P&L’s worth of data. Some of this data may exist, and some may require calculations.
Here’s what you’ll need:
- Customer Counts
- ARR (Annual Recurring Revenue)
- Retention Rates
- CTS (Cost-to-Serve)
- CAC (Cost of Acquisition) aka Sales and Marketing Spend
The above data is analyzed on a trailing basis, so pull the past 13 months.
If this data isn’t available or organized in this fashion, this is a BIG opportunity to put process and analytical frameworks in place.
This will get you promoted FASTER too. 🙂
Step 1: Determine ARR CLTV
CLTV is just like a P&L (Profit and Loss statement).
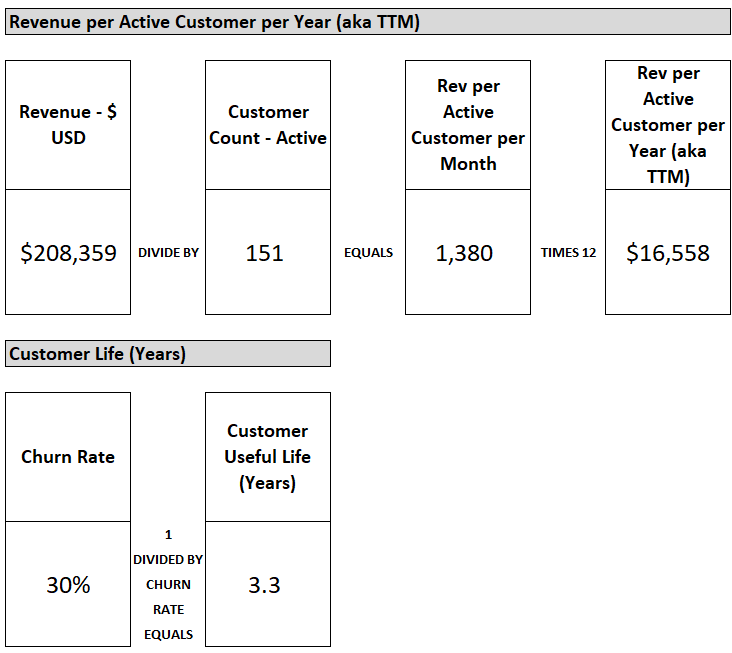
Start with revenue at the top and figure out how much ARR your customer population will generate over their useful life.
Useful life can be calculated by understanding annual churn rate. Total calculate churn take the customer count in your population from 13 months ago. Figure out how many customers in your current month are left from that customer group that was active 13 months ago.
That gives you retention rate, which gives you churn rate, which gives you useful life in months and years.
Congrats, you now have ARR CLTV!
ARR CLTV = ARR times useful life in years.
Here’s a breakdown below:

Have ARR by customer and useful life in years, and your one third of the way to calculating CLTV.
Step 2: Determine CTS per Customer
CTS can be extremely high-level or precise depending on how deep you want to dive.
Consider things like products, service geography, and customer activity by segmentation.
For now, let’s keep it simple.
List out all the departments in your company that spend money. Now tag the ones that deliver your product or service to them. These are your CTS departments. Examples include:
- Customer Support
- Technical Operations
- Account Management
Take these departments and their spend in the latest month.
Divide this total spend by active customers in the current month to determine high-level CTS per customer.
We’re getting closer. You now have GP (Gross Profit) CLTV.
Step 3: Determine CAC Costs per Customer
CAC can also be extremely high-level or detailed. Think about all the marketing channels and countries your company spends money in.
Again, let’s keep this simple.
Take your list of departments from step 2 and tag all the ones related to selling or marketing to your customers. Figure out the total spend in the current month.
Then figure out how many new customers you added in the current month.
Divide Sales & Marketing (S&M) costs this month by new customers this month to get CAC.
This simple approach assumes your S&M spend drives new business in the month it’s spent. If you want to get more precise, figure out how long it takes for S&M spend to generate new customers.
Could be 1 month, 3 months, or 6 months. This all depends on the business.
You now have every variable needed for CLTV.

Conclusion: You Just Learned CLTV and Made Yourself More Promotable
You can now calculate CLTV from revenue thru CAC.
This doesn’t come easy to most, and when you roll this out at your company you are going to look GOOD.
There are so many questions this analysis can answer when integrated with other customer, product, and marketing channel data:
- What channels maximize our return?
- What customer segments should we market to?
- What product mix is most effective?
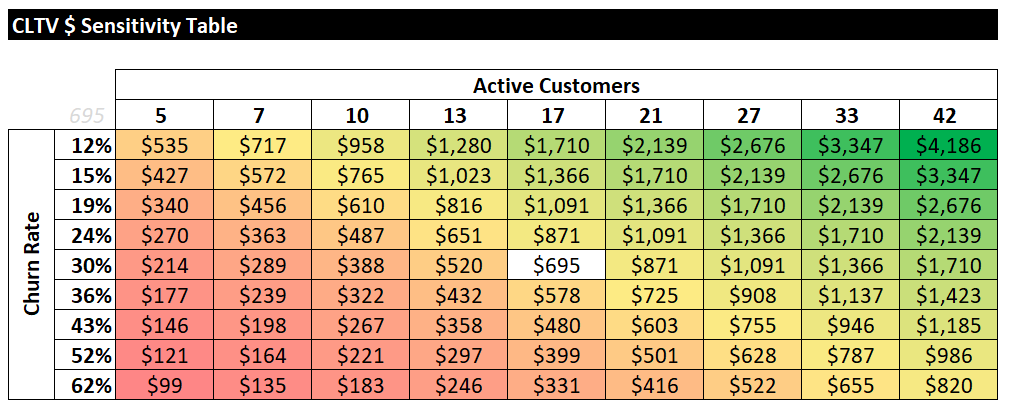
Consider using visuals to show CTLV sensitivity as variables in your equation change.
For example, a sensitivity table that shows how changes to CAC and CTS can impact CLTV (green = profitable, red = unprofitable).
Ultimately…

Have fun making an impact on your business and your career!
Cheers,
Drew & Yarty
PS: This post is 100% human-made 💪


