In our collective experiences, we’ve worked for 10 companies that had +1,000 employees.
Two of those we worked for are Fortune 100 companies with over 100k people!
What did they all have in common? Favorable profits versus forecast driven by attrition.
Why did this happen? Because no budget owner planned for it. And technically they were right to not plan for it. The person responsible is the company forecast owner.
By planning for attrition, we were able to develop accurate profit forecasts. This led to faster promotions for our teams.
And guess what?
Planning for attrition is not rocket science. Anyone can do it.
Let’s dive in!
What is Attrition?
Attrition is defined as when employees depart from the organization for any reason (voluntary or involuntary).
This might include resignations, terminations, death, or retirement.
The easiest way to think about it is if an employee leaves the company for any reason.
For example, let’s say you have 100 employees as of today. Tomorrow two people decide to leave.
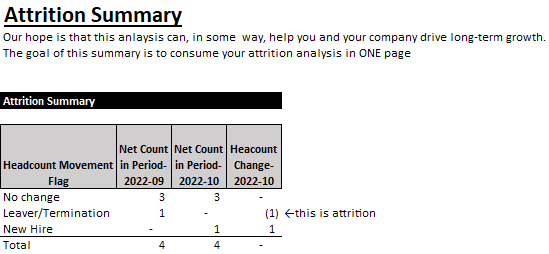
Your attrition count is 2, and your attrition rate is 2% ((2 ➗ 100) ✖ 100).
Attrition plays a big factor in your company’s profit plans.
What you’ll need to perform attrition analysis
To start you’ll need to organize headcount (aka employee) data with the following info:
- Role ID
- Start and end date
- Annual compensation
This data should be made available to you every month via a snapshot process and be blessed by both internal HR/recruiting and the HR finance business partner. It’s important your key stakeholders agree to the same numbers.
Now, what’s a snapshot process?
It’s downloading your data from your system at that particular moment in time (a snapshot).
Why’s it important?
Because data updates continuously, and the snapshot process allows you to track any changes between periods.
If that process doesn’t exist, this is another BIG opportunity for you to get promoted faster by implementing an important process for reporting.
Trust us, your business partners and your Head of Finance will love you for it. 😉
Step 1: Calculate Number of Headcount for Prior 24 Months
This is easier than it sounds.
Your workforce management system may already do this. If not you can create active headcount columns for the last 24 months by netting together two waterfall tables in excel using:
- Start dates that populate a “1” in a given active month
- End dates that populate a negative 1 “-1” in a given non-active month
- Net of above you get a 1 for active employees and a ZERO for inactive employees
For example, if role ID 123 has a start date of September 1st, 2021, that role should have a 1 for every month going forward after September 2021.
And if that same role ID leaves the company in October 2022, then that role should have a negative 1 for every month going forward from October 2022.
Net of the above role ID 123 would show as active in every month from September 2021 thru September 2022 just like this:

Step 2: Calculate Monthly Attrition
Now that you have active headcount data by month, you can figure out how many headcounts were NEW HIRES each month and how many LEFT COMPANY each month (aka attrition).

ADDED BONUS: Not only does this help you understand attrition, you’ll also understand the actual hiring capacity of your recruiting teams and match that up against your hiring plans.
Usually, there are more savings to be had in delayed hired assumptions. Another way to make your profit forecast more accurate. 🙂
Step 3: Create Attrition Assumption in R&O (Risk and Opportunities)
Now that we know historical monthly attrition rates, we can figure out the savings to expect each month and put these in our financial forecast.
Now, no budget owner can predict attrition at the employee level, so spare them the exercise and make it part of your R&O process.
Reality is attrition is an educated guess, but knowing your history gives you data-driven confidence behind it. And you can measure your results the following month against your R&O assumption using the analysis above.
It may sound “Risky” to put this “Opp” in the R&O…but trust me your profit forecast will be that much more accurate.

Conclusion: You Are Now a MORE Accurate Profit Forecaster!
The only thing you can guarantee with a profit forecast is that it will be WRONG 100% of the time.
Seriously, there are lots of moving parts.
The trick is not being wrong by much AND being able to explain where you missed, so you can adjust accordingly next time.
You will have attrition in your company.
But having data to understand how it’s behaved in the past will give you the ammunition to make a bold (and more accurate) assumption in your next profit forecast.
How about you? How do you feel about attrition analysis now?
Let us know and we’ll share your thoughts in our next posts.
Have fun making an impact on your business and your career!
Cheers,
Drew & Yarty
PS: This post is 100% human-made


