👋 Hey there,
Have you ever struggled to explain your company’s revenue results?
You and me both.
Today’s topic is on how to explain revenue performance using volume, mix, and price analysis (VMaP).
This post covers the following:
- Why revenue analysis is so important
- How to analyze revenue performance using volume, mix, and price analysis (VMaP)
- Ways to take action and drive better revenue performance
Using our guide, you can explain your company’s revenue performance.
Regardless of the industry you’re in or how complicated it may be.
Let’s dive in and make you look good.

What is revenue performance
Revenue is the income your company generates by selling products and services to its customers.
Without revenue, there is ZERO operating cash flow.
So it goes without saying revenue is important to the longevity of your company.
A lot goes into driving revenue performance:
- Sales positioning
- Pricing decisions
- Product offerings
Your mission is to interpret what these results mean and improve them.
You can use volume, mix, and price analysis (VMaP) to do this.
What is volume, mix, and price (VMaP) analysis
Let’s get super scientific and talk about stuff.

Stuff is anything your company sells to an end consumer (business or individual).
Examples include:
- Services (e.g. consulting, marketing agency, lawn mowing)
- Tangible products (e.g. mittens)
- Digital products (e.g. excel template)
- Software products (e.g. Salesforce)
And selling stuff can be isolated down to three drivers:
- Volume = You sell more or less stuff
- Mix = You sell different types of stuff
- Price = You sell stuff at higher or lower prices
Volume + Mix + Price = Total Revenue Change
Each of these drivers have unique impacts on your business’ top (revenue) and bottom (profit) lines.
Why revenue performance is important
Selling stuff requires effort.
Effort = Resources
Help your company allocate its resources to ensure revenue targets are met.
Questions you should know the answers to:
- Do you need to ramp up production?
- Do you need to shift resources to other products / services?
- Do you need to tighten spending to support discounting?
Consider all of these in your profit and cash forecast.
🔥TIP: Learn how to profit forecast with financial rigor here
Let’s break down revenue performance into volume, mix, and price.
Examples of volume, mix, and price (VMaP) analysis
Now onto the good stuff.
Let’s walk through the individual components of volume, mix, and price.
We’ll then fire up the spreadsheet with a simple example to test.
Volume
Selling more or less stuff is anchored on a unit of measure.
Unit of measure examples include:
- Users (software licenses)
- Customers (healthcare)
- Units (e-commerce)
Start simple and think of units of apples. 🍎
You sell apples and only apples.
How would you explain selling 1 additional unit of an apple at the same price point, which drove revenue growth of $1?

Answer = $1 of Volume
You sold a higher (more) quantity of the same stuff.
This simple concept is front and center in today’s current events.
Ever heard of the semiconductor company Nvidia?
That’s a lot of volume, which impacts:
- Hiring plans
- Manufacturing capacity
- Shipping
As the AI and ChatGPT boom unfolds, Nvidia will be tracking the impact of volume on its revenue very closely.
🔥TIP: Learn how to shrink your workweek using ChatGPT by reading this
Mix
Mix is about changing the type of stuff you sell.
Your apple empire has an opportunity to sell units of cookies. 🍪
How would you explain selling the same number of apples but then introducing a new cookie product, which drove $2 of revenue growth?

Answer = $1 Volume and $1 Mix
Your quantity of items sold went up by 1 unit, which counts as $1 of volume increase.
The additional $1 from selling the more expensive unit of cookie counts as mix.
Your company may sell certain products today and introduce new products over time.
It happened to Starbucks.
When Starbucks launched many decades ago, it was all about traditional coffee.
Over time Starbucks introduced customized drinks, food items and even merch.

Food items like cake pops have helped the company to grow their revenues.
It has also impacted their profit margins to accommodate changes in:
- Supply chain
- In-store design
- Marketing
Starbucks closely tracks its revenue mix to ensure revenue achievement and resource allocations align.
Thanks Starbucks’ FP&A team. 👊
Price
But wait, you realize shipping costs have increased.
You now need to start charging more for your apples.
Changing the price of a product you already sell is what price is all about.
You may also hear the term “business levers”.
It’s just a fancy way of saying a business can influence decisions like revenue using things like price.
Now, how would you explain selling the same number of apples but at a higher price, which drove $1 of revenue growth?

Answer = $1 Price
You sold the same number of units, and the same type of units.
The only change was how much you sold the units for.
Price impacts are important to measure because they have ZERO impact on resources to produce and ship to your customer.
Has your wallet felt the pain of inflation?

That’s the revenue driver of price in action in today’s world.
Think about your groceries.
The cost of groceries has gone up A LOT over the last few years.
The grocery stores are tracking price closely to ensure they cover input costs.
Any company experiencing higher input costs (essentially all companies nowadays) should be reviewing its pricing strategy.
🔥TIP: Read this to learn how to take charge of your company’s pricing strategy
How to perform volume, mix, and price (VMaP) analysis
Let’s walk through a more complicated example.
Start with revenue data from calendar year 2021 and compare it to 2022.
Compare units, sales, and price over two periods
Your revenue GREW by $4,200.
$4,200 = $10,700 - $6,500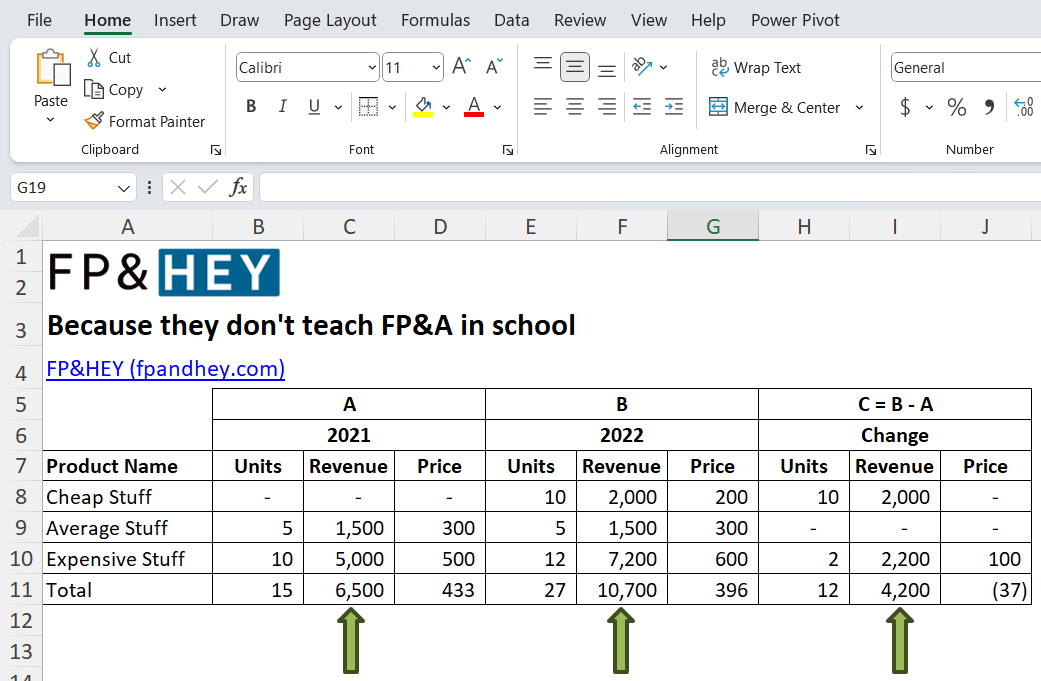
Units GREW by 12.
12 = 27 - 15
And price went DOWN by $37.
($37) = $396 - $433
That means units grew faster than revenue.

Let’s cut to the chase, here’s the answer you can send to your CRO and CFO.
👋Hello Executives,
Our revenue results are in: we’re up +$4,200 in 2022 vs 2021.
Volume was the driver, with negative product mix driving price per unit down.
Key FAVORABLE (F) and UNFAVROABLE (U) drivers include:
- F: $5,200 from volume driven by selling our new Cheap Stuff
- U: $2,200 from mix driven by Cheap Stuff volume growth and its low price
- F: $1,200 from price driven by price increases in Expensive Stuff
The above lines up with our initiatives this quarter.
- We decided to capture the lower priced market by selling Cheap Stuff
- We increased the price on Expensive Stuff to cover higher input costs
We expect similar revenue growth and price erosion as this strategy unfolds.
To stabilize pricing, we could increase the price on Expensive Stuff even more.
Hope that’s helpful, reach out with any questions.
Cheers,You’re Very Promotable FP&A Person (aka you) 💪

How did we get this incredible info?

We used a spreadsheet and algebra to calculate volume, mix, and price.
Which you can do in your own spreadsheet.
Create your revenue analysis section
Add a section dedicated to creating your revenue analysis for each row of data.

Calculate volume
Volume anchors on the prior selling price of $433 and flexes for the unit change for each product.
Apply this formula to each row of data in the Volume column.
=H8*$D$11
Calculate mix
Mix takes the difference in price between the product and the total average, then flexes for the unit change.
Apply this formula to each row of data in the Mix column.
=IF(D8=0,(G8-$D$11)*H8,(D8-$D$11)*H8)
Calculate price
Price compares the price paid for each product in the current year vs the prior year and flexes for the unit change in each product.
Apply this formula to each row of data in the Price column.
=J8*E8💡FUN FACT: If a product did not exist in the prior period, there is ZERO price impact for that product. See our Cheap Stuff product as an example.

Calculate the total
Add up your volume, mix, and price drivers.
Apply this formula to each row of data in the Total column.
=SUM(K8:M8)
Build checks into your model
Your total must tie back to the total revenue change.
ALWAYS check your work by creating tie-outs to other sections.
Apply this formula to every row under the CHECK column.
=N8-I8
Highlight big impacts
Add in conditional formatting to help see trends.

🔥TIP: Read here on how to use conditional formatting to highlight trends
You can see that Cheap Stuff was the biggest driver, impacting both volume and mix.
And a smaller driver was Expensive Stuff selling more units with positive pricing.
Create a visual
Now create a waterfall chart for visual consumption by stakeholders.

🔥TIP: Read here to create waterfall charts in minutes
Charts are a great way to visualize results in presentations and emails.
Now do this on a bigger data set
You just learned how to do revenue analysis using volume, mix and price.

And the best part?
This framework can be used for 3 rows or +1 million rows of stuff.
Try it out on your own data and see for yourself.
How to interpret revenue performance
Do NOT just report historical results.
Focus on helping to influence future results.
By doing so, you’ll increase your odds of getting promoted.
And you do this by diving headfirst into business partnering.
Here are three tips to help you get promoted faster:
🔥Tip #1: Help sales crush their quota by managing quarterly sales targets
🔥Tip #2: Help marketing target high-value customers using CLTV
🔥Tip #3: Help product create products that increase white space
Help your fellow co-workers do their daily jobs better.
It will build your own personal brand as the go-to FP&A person. 💪
Conclusion: You OWN your company’s results
Congrats, you can now tell the story of revenue performance.
AND help make that performance way better in the future.
This will help you in your quest for an internal promotion.
Or brag about this skill when interviewing for new jobs.
Either way, your long-term career success will benefit greatly. 😉
Have fun making a BIG impact at your company with your newfound revenue analysis skills.
Ready to take charge of revenue performance at your company?
Let us know by emailing us with your experiences and thoughts.
We’re also always looking for fresh new ideas and topics to help you grow your FP&A career, so let us know.
Now go have fun making an impact on your business and your career!
Cheers,
Drew & Yarty
PS: This post is 100% human-made