👋 Hey there,
If you just had a long holiday weekend, we hope you enjoyed it.
We sure did, which is why this post is 1 week late. 🏖
Today’s topic is how to perform break-even analysis, an essential FP&A skill.
We’ll cover the following:
- What is break-even analysis and why it’s important
- Components of break-even analysis
- Steps to performing a break-even analysis
- How to visualize and interpret break-even analysis
Break-even analysis provides valuable insights into the financial health of your company.
It’s kind of a big deal, regardless of the type of company you’re in.
Let’s dive in and help improve the financial health of your company using this critical FP&A skill.
What is break-even analysis
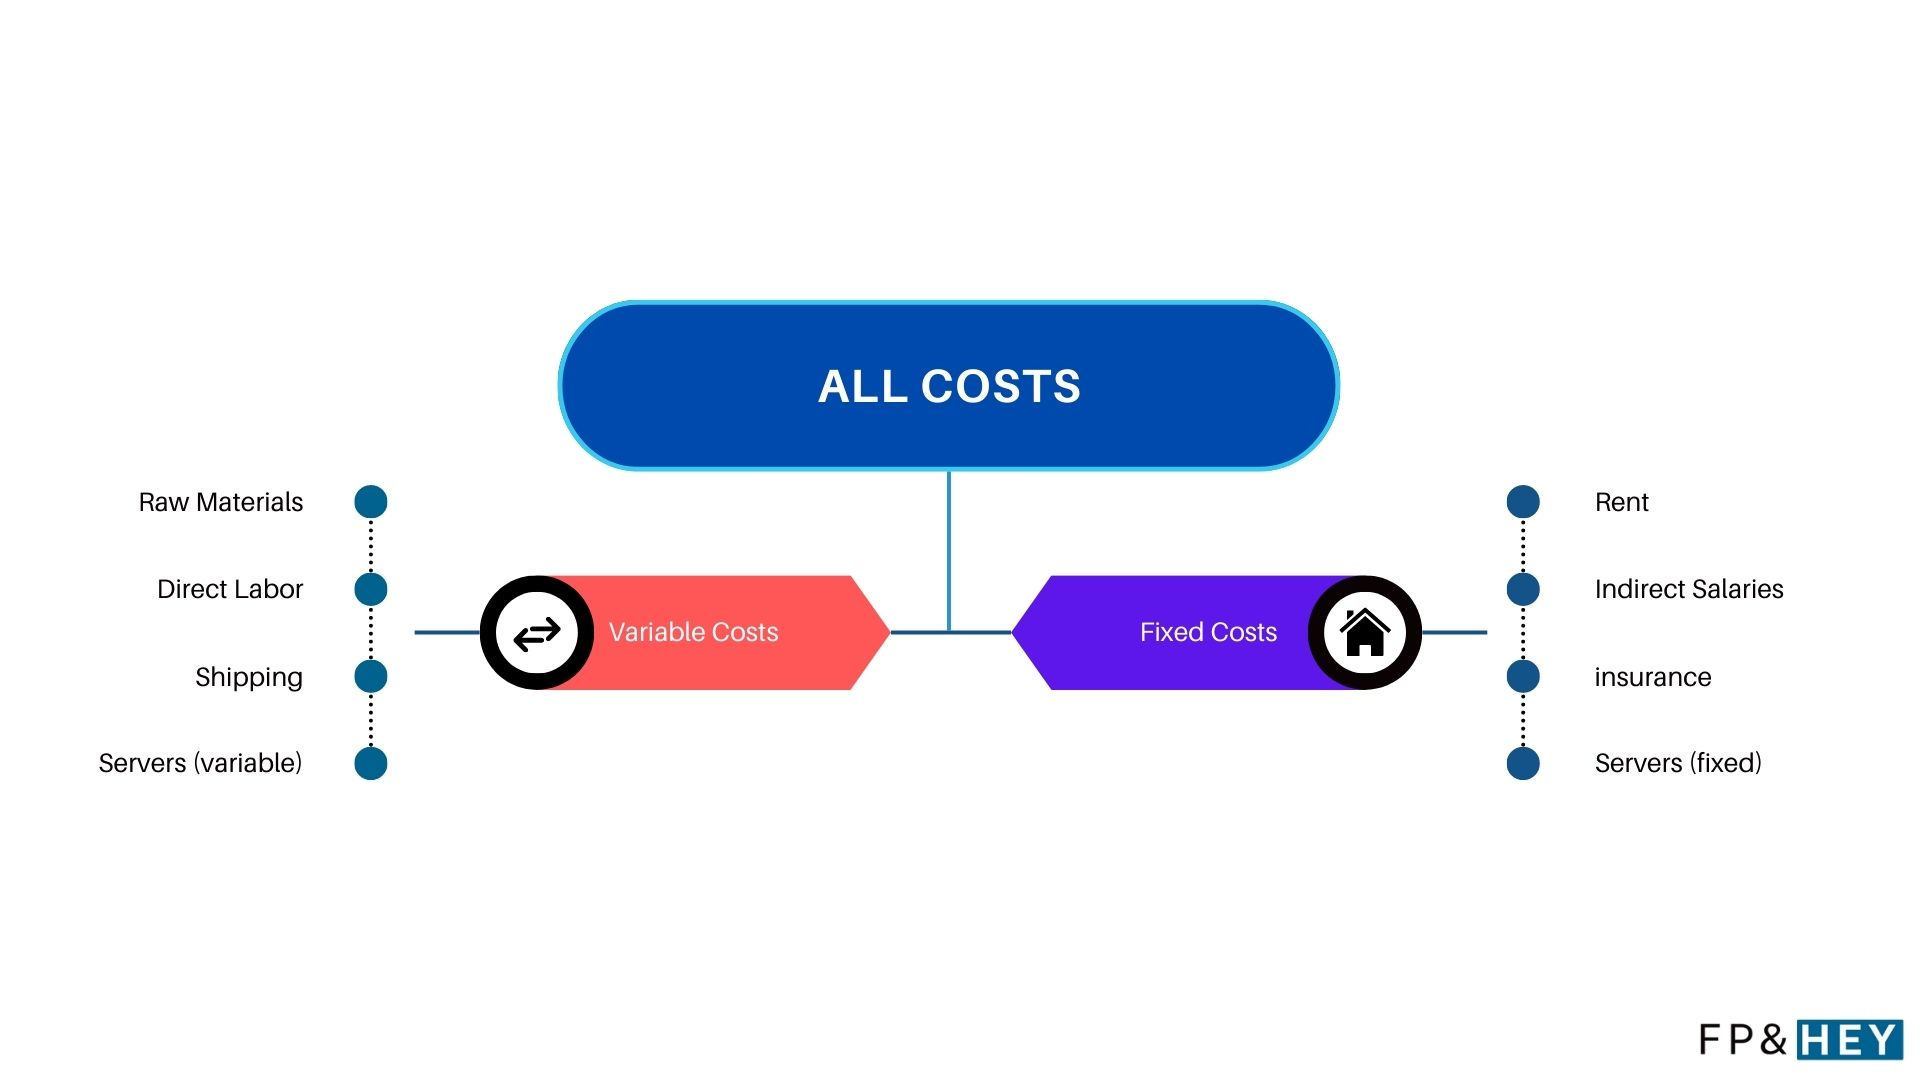
Break-even refers to the number of units your company needs to sell in order to cover all costs.
All costs = variable plus fixed costs
If you’re not breaking even, you have ZERO chance of making a profit.
That ain’t healthy.👎
And trust us, your CFO and executives won’t be happy.
Things to assess when analyzing break-even include:
- Pricing strategies
- Production volume
- Customer profitability
- Resource allocation
To improve your company’s financial health, you must understand all of the components of your break-even analysis.
So let’s break them down. 🔨
What are the components of a break-even analysis
Break-even is a simple algebra equation.
Break-even Units = Fixed Costs ÷ (Price – Variable Costs, aka Contribution Profit)
This equation has a few variables.
Units
Your company sells stuff.
- Stuff = Units
- Stuff = Users
- Stuff = Customers
Whatever your company sells or whomever your company sells to can be considered a unit in your break-even equation.
Price
Price represents the amount of sales your company generates by selling 1 unit.
These sales generate your company’s revenue.
🔥TIP: Learn how to analyze your company’s pricing by reading this
Variable costs
It’s all about volume.

When your company sells more stuff, variable costs increase.
When your company sells less stuff, variable costs decrease.
Variable costs examples include:
- Raw materials
- Direct labor
- Shipping
- Servers (if usage drives more server purchases)
These costs are constantly changing and important for FP&A teams to stay close to.
Fixed costs
Some things in life don’t change.
That’s the idea behind fixed costs.
Fixed costs remain the same, regardless of how many units your company sells.
Fixed costs examples include:
- Rent
- Indirect salaries (aka administrative roles)
- Company insurance
- Servers (if usage does not drive more server purchases)
You CAN change these costs using negotiation tactics.
For example, try negotiating a better manufacturing center rental agreement.

What are the steps to calculate break-even
Now you know the break-even equation.
Let’s fire up the spreadsheet and perform the calculation.
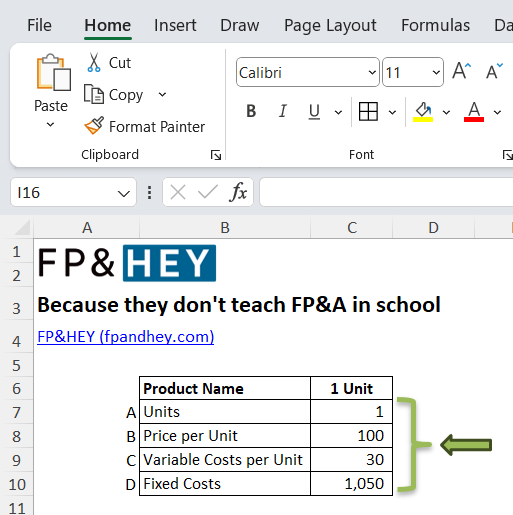
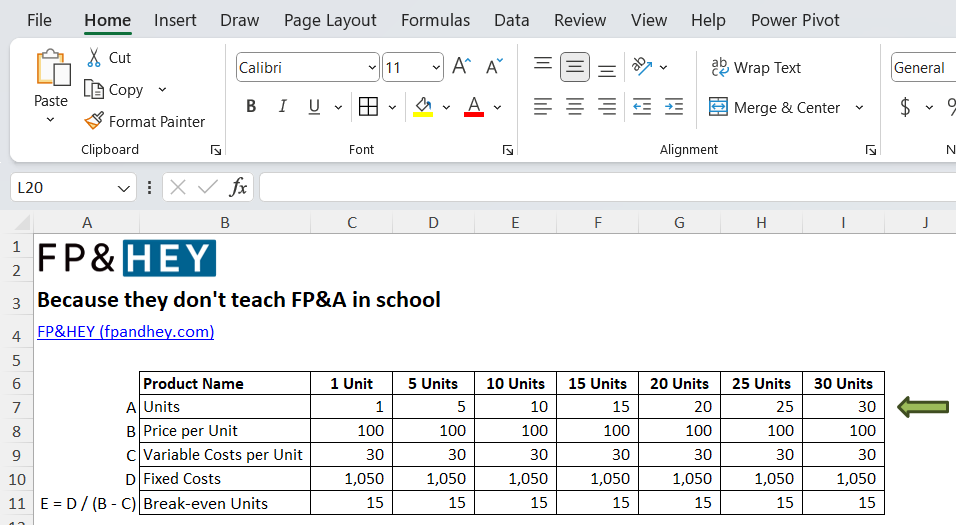
Step 1: List out all your variables
Remember the four variables above?
List them out in your spreadsheet just like this as if you were selling 1 unit.
Step 2: Calculate break-even
Time to dust off the algebra you learned in elementary school.
Use this formula to show how many units it takes to break-even.
=C10/(C8-C9)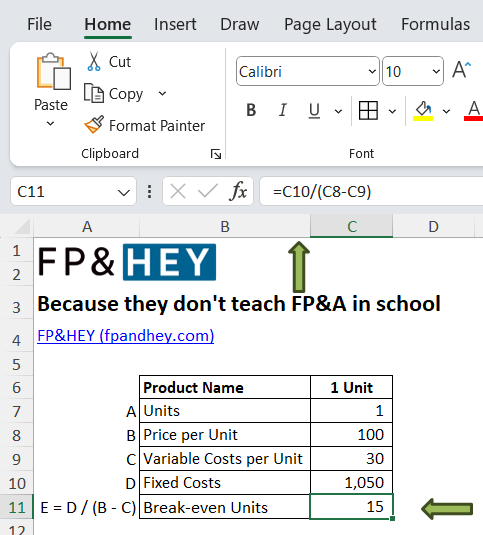
Step 3: Answer the break-even question
Pop quiz: how many units does it take to hit break-even profit?
15 units

Now let’s take this further and create some volume scenarios.
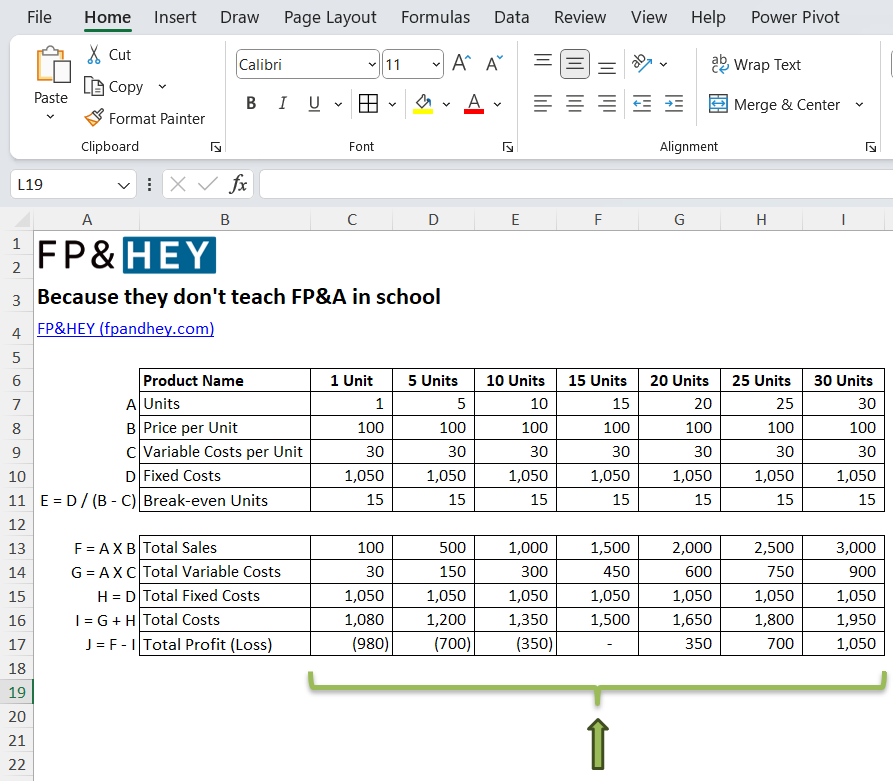
Step 4: Create unit volume scenarios
Create 6 more columns to the right and steadily increase the units.
Keep all of the other variables the same.
Now let’s figure out how these scenarios impact profit.
Step 5: Analyze scenario profitability
Calculate total sales.
=C8*C7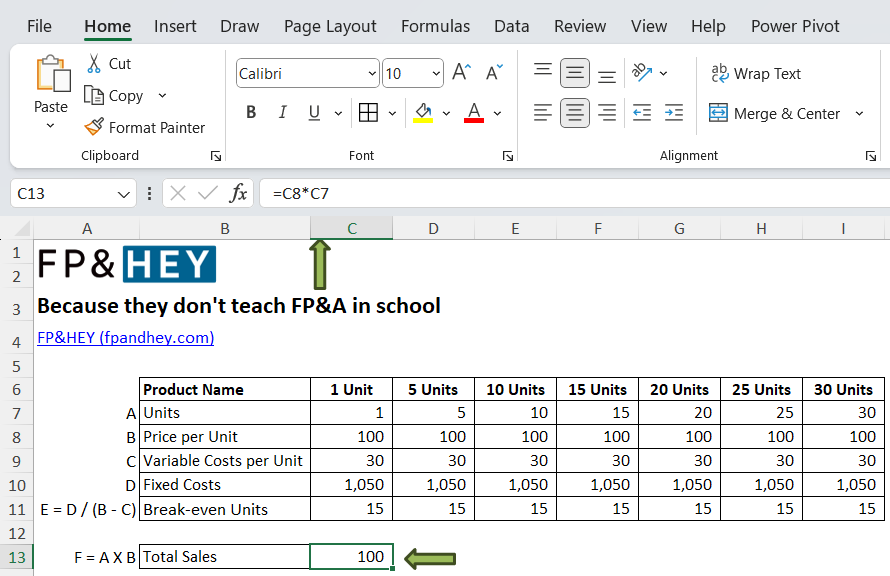
Calculate total variable costs.
=C9*C7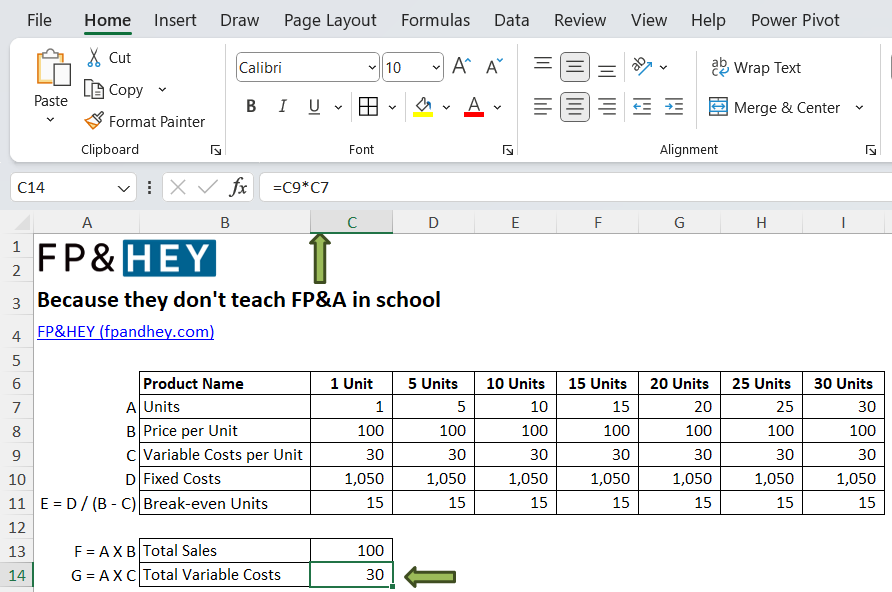
Calculate total fixed costs.
=C10
Calculate total costs.
=SUM(C14:C15)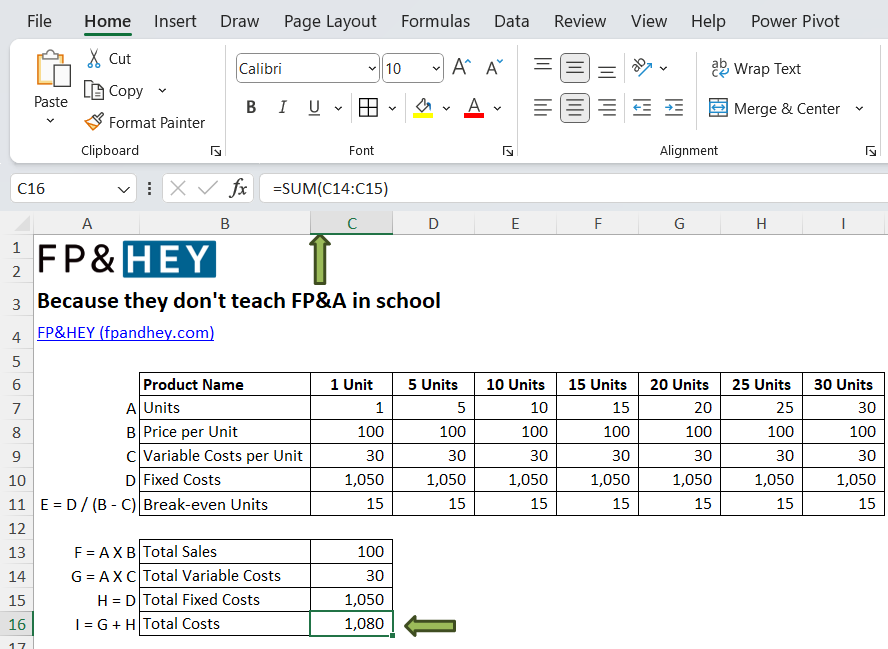
Calculate total profit (loss)
=C13-C16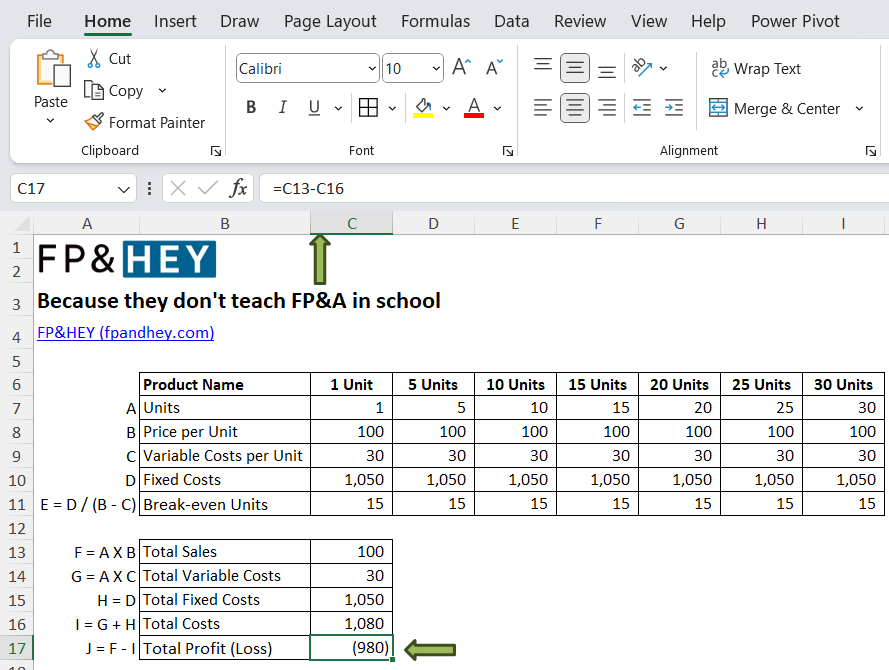
Paste your formulas across to cover all unit volume scenarios.
🔥TIP: Read this to copy and paste at lightning speed by using Excel shortcuts
And add a splash of color to your profit (loss) line to make it easy to interpret.
🔥TIP: Learn how to use conditional formatting by reading this
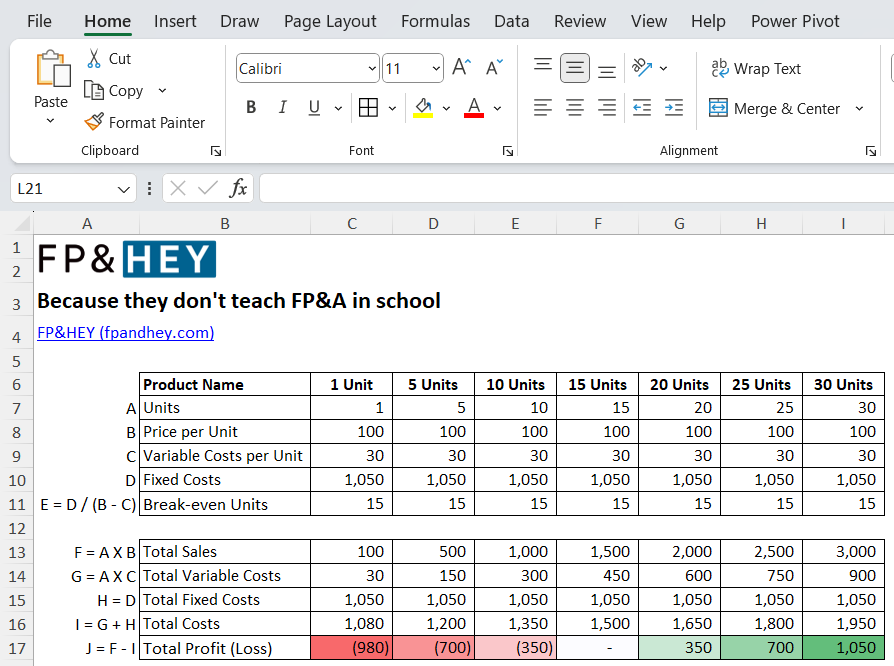
And there you have it—a table full of unit volume scenarios and the profitability of each. 💪
This information is helpful to understand how profitable your company can be.
For example, if your manufacturing site maxes out at 30 units per month, guess what your max profit will be in a given period?

Hint: It’s in your table….$1,050
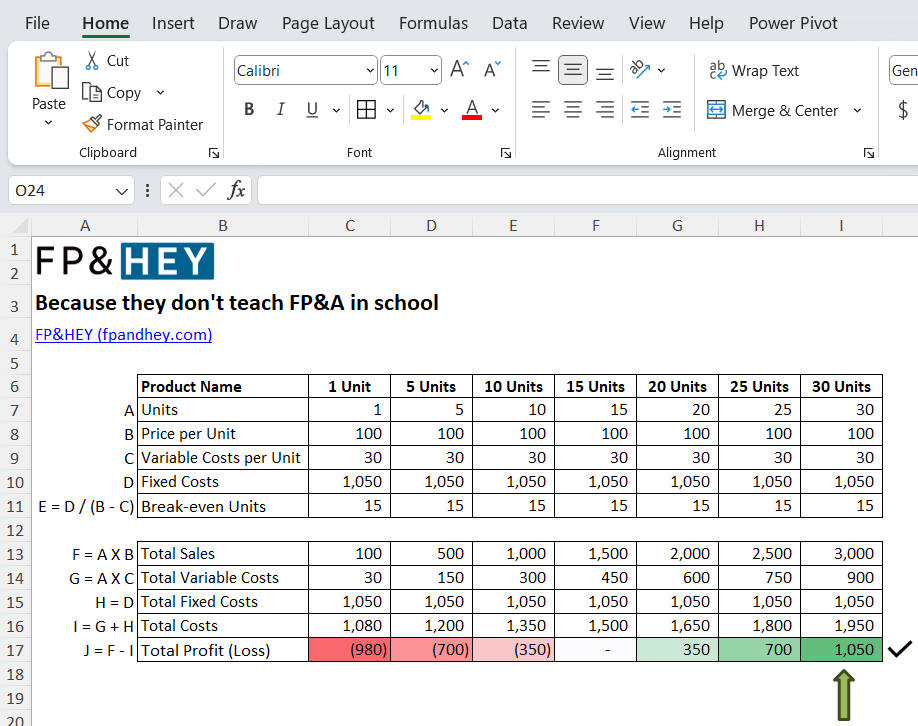
Does your company need more profit than $1,050?
Time to take action.
Step 6: Take action to influence future profit
Best-in-class FP&A analysis provides actionable insights.
What can your company do to increase its max profit of $1,050?
- Increase production capacity 👉 requires investment in equipment
- Increase price 👉 requires pricing strategy
- Lower fixed costs 👉 requires contract renegotiations
- Lower variable costs 👉 requires purchase agreement renegotiations or new vendors
Help your company understand what levers they can pull to influence future results.
That’s what FP&A is all about.

Conclusion: You can improve your company’s financial health
Break-even analysis is an essential FP&A skill, and it’s now in your tool belt.
Use this tool to help your company financially thrive.
It’s also a great resume item to help you land that next FP&A job or be in line for that coveted promotion.
Because this skill applies to virtually all companies.
Keep opening those career opportunity doors by learning a little each day.
And have fun making a positive impact on your company and your career.
Ready to take control of your company’s financial health?
Let us know by emailing us with your experiences and thoughts.
And if you have any topics you’d like us to cover to grow your FP&A career, so let us know as well.
Now go have fun making an impact on your business and your career!
Cheers,
Drew & Yarty
PS: This post is 100% human-made 💪