👋Hey there,
What’s more important than acquiring customers?
NOT losing them (aka churn).
Today’s topic is how FP&A teams can calculate and reduce customer churn.
This post covers the following:
- Why understanding customer churn is important
- How to calculate customer churn
- Ways to analyze and reduce churn
You can save your company from losing customers. 🙌
Which makes you a big winner when promotions are given.
Now let’s talk about bathtubs.

What is customer churn
Filling up a bathtub with water is like trying to grow your customer base.
Bathtubs take time, effort, and money to fill.
But what happens when you try to fill a bathtub and don’t plug the drain?
You lose a lot of water.
And worse…the bathtub takes FOREVER to fill.

Customer churn is like water flowing through an unplugged drain.
It happens when customers you worked so hard to acquire decide to say goodbye.
Examples of customer churn include:
❌Cancelled contracts
❌Closed accounts
❌Non-renewal of subscriptions
Churn makes growth harder, more expensive, and hurts the bottom line.
Why is customer churn important
Acquiring new customers is expensive and time-consuming.
These very reasons are why retaining customers are so important.
👉Learn how to spot your best customers here.
The longer you keep those customers, the more money you make from them. (CLTV article here)
Don’t waste all that acquisition effort.

Customer churn is also a leading indicator of major issues with:
- The product you sell
- The service you provide
- The price you charge
- The customer support you offer
Fix those issues ASAP and plug that leaky bathtub to accelerate growth.
Understanding customer churn rate
Customer churn rate is the % of customers lost during a certain period.
The best companies look at churn monthly and annually.
And they track it consistently every single month.
How is your customer churn rate trending?

Once you have the data at your disposal, it’s critical to investigate the drivers of and reasons behind churn.
Calculating customer churn rate
Investigation requires data to figure out WHO is churning.
To calculate the customer churn rate, you need 3 things:
- List of active customers at the beginning of the period
- List of active customers at the end of the period
- Flag customers that were active at the beginning and not active at the end
Let’s fire up the spreadsheet and look at an example below.
Churn example
Start with your list of customers going down and time periods going across as shown below:

Your company started with 10 active customers and ended with 13.
That’s a change of 3.
Congrats! Your company grew.🥳
🔥TIP: Use data tables to create your churn analysis.
Now understand HOW your company grew.
Add a column to measure new customers.
To do this, count any customers with a “+1” in the change column.

You added 5 new customers in the ending period.
But why did you only increase the customer count by 3?
Answer: Churn
Add another column to measure churn customers.
To do this, count any customers with a “-1” in the change column.
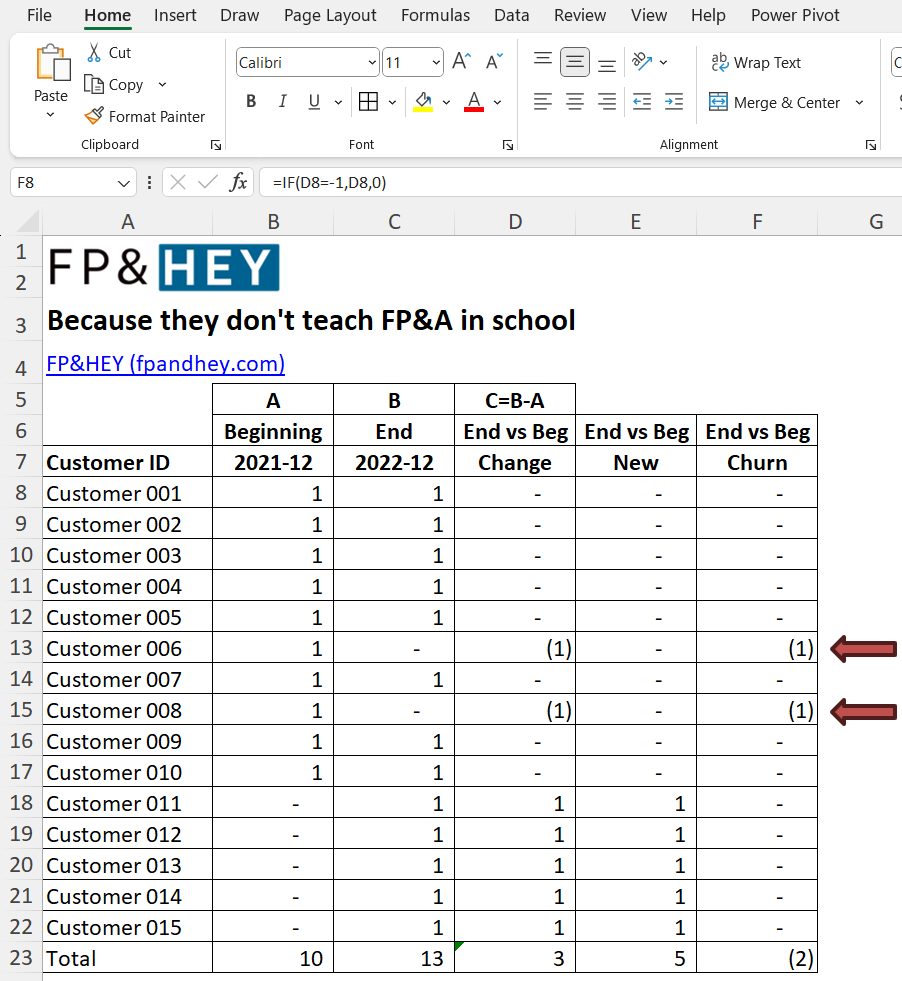
You lost 2 customers to churn out of the original 10.
Your customer churn rate is 20%.
Customer Churn Rate = (2 / 10) = 20%Let’s find out if that’s good or bad.
Interpreting customer churn
Customers will churn, it’s a fact of life.
To interpret your company’s customer churn, you’ll need to understand a few things.
Industry benchmarks
Every industry is different.
So it goes without saying churn rates will vary.
Do you know many people that terminated their Microsoft subscription?

SaaS companies tend to have lower annual customer churn rates, typically in the single digits.
Do you know many people that joined a gym, quit, and joined another one?

Fitness companies tend to have annual customer churn rates as high as 40-50%.
Research your industry’s customer churn rate to understand how you stack up.
This info is available on the web.
Then benchmark against your company’s churn rate.
Track history
Is your company’s churn rate improving or getting worse?
It’s a critical non-financial metric that should be reviewed consistently.
Review customer churn with your customer support team EVERY month.
Learn more about how to present info to your business partners here.

You’ll learn a ton and find ways to materially reduce future churn, i.e. DIRECT impact to the business.
Now you’re helping business partners hit essential business goals and marching towards that promotion.
Identify drivers
Build up a robust history of churn customers through your monthly reviews.
Now work to understand WHY those customers are churning.

You can create churn categories from this info.
Examples of churn reasons include:
- Price
- Support
- Quality
- Product/Service needed anymore
These categories allow you to take specific actions with your business partners.
Trust us, they’ll love you for it and appreciate you helping them.
Strategies to reduce churn
You can’t go back in time to prevent the churn that happened.
But you can look forward.
Use information from the past to reduce future churn and improve retention.

There is no shortage of areas you can focus on to plug that leaky bathtub.
Think about the products and services you use every day.
What makes them great?
Improve customer experience
Customers have questions.
Your company must be quick to address them.

The best customer support teams leverage case-tracking systems to manage incoming customer questions.
Track your customer support team’s case tickets:
- How fast are they responding to the initial case question?
- How long does it take to resolve the case entirely?
- What was the customer’s feedback after the case was resolved?
Ideas to help your organization scale its customer support teams:
💡Reduce the number of cases raised by building a public Q&A / Help page that customers can access to address common questions.
💡Eliminate some customer questions altogether by creating thorough educational material for onboarding and ongoing use.
Note, however, that you should still expect case tickets.
It means your customers are using your product or service.🙂
Make the product better
Life is good when your customers are happy.

Understand how they feel by measuring customer satisfaction.
You can do this by capturing your customers’ Net Promoter Score (NPS).
Analyze these scores across customers and products.
And then transform those unhappy customers into your biggest fans.
Add a personal touch
Every customer is different, so make them feel special.
Personalization is key.
Segment them to tailor your communications and offers.
And don’t be afraid to pick up the phone for an old fashion chat.

Human interaction goes a long way in building long-term relationships.
Conclusion: You helped your company lose less, which is a BIG win for your career
You did it, you prevented customers from leaving.
Churn reduction is not the sexiest topic.
But guess what happens as a result?
✅Your company’s valuation grows (thanks CLTV)
✅Your personal brand skyrockets (hello future promotion)👋
Keep crushing your career and have fun while doing it.
Ready to take customer churn head-on?
Let us know by replying here or emailing us.
We’re always looking for fresh new ideas and topics to help you grow your FP&A career, so let us know.
Now go have fun making an impact on your business and your career!
Cheers,
Drew & Yarty
PS: This post is 100% human-made